
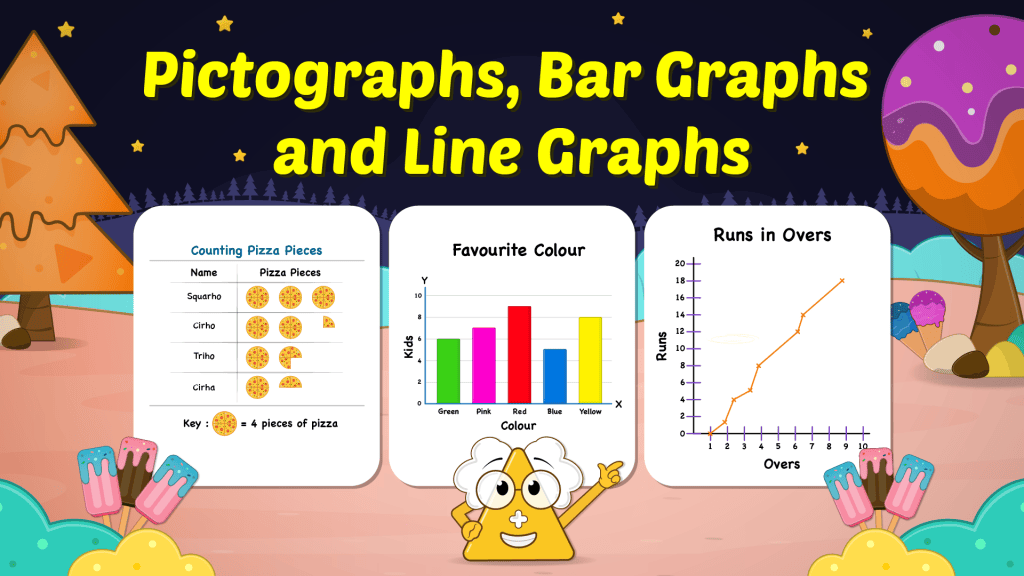
If you have ever looked at your kid’s math homework and found yourself staring at a page full of pictures, bars and wiggly lines, wondering what it all means, you are not alone. Data handling sounds like something reserved for offices and spreadsheets, but for kids aged 8 to 11, it’s actually a lovely way to explore the world around them. And when it’s taught with heart, head and hand, it becomes more than just numbers. It becomes a story.
Let’s walk through it together, mumma to mumma, parent to parent.
Why Data Handling Matters at Home
Think back to your own kidhood. Maybe you counted how many red cars passed by your window, or kept track of how many mangoes were sold at the market. That was data handling in its simplest form. For kids, it’s not just about math. It’s about noticing patterns, asking questions and making sense of everyday life.
When your little one learns to read a graph, they are not just decoding symbols. They are learning to interpret, to reason and to communicate. And when they create their own graphs, they are telling a story. One that starts with curiosity and ends with understanding.

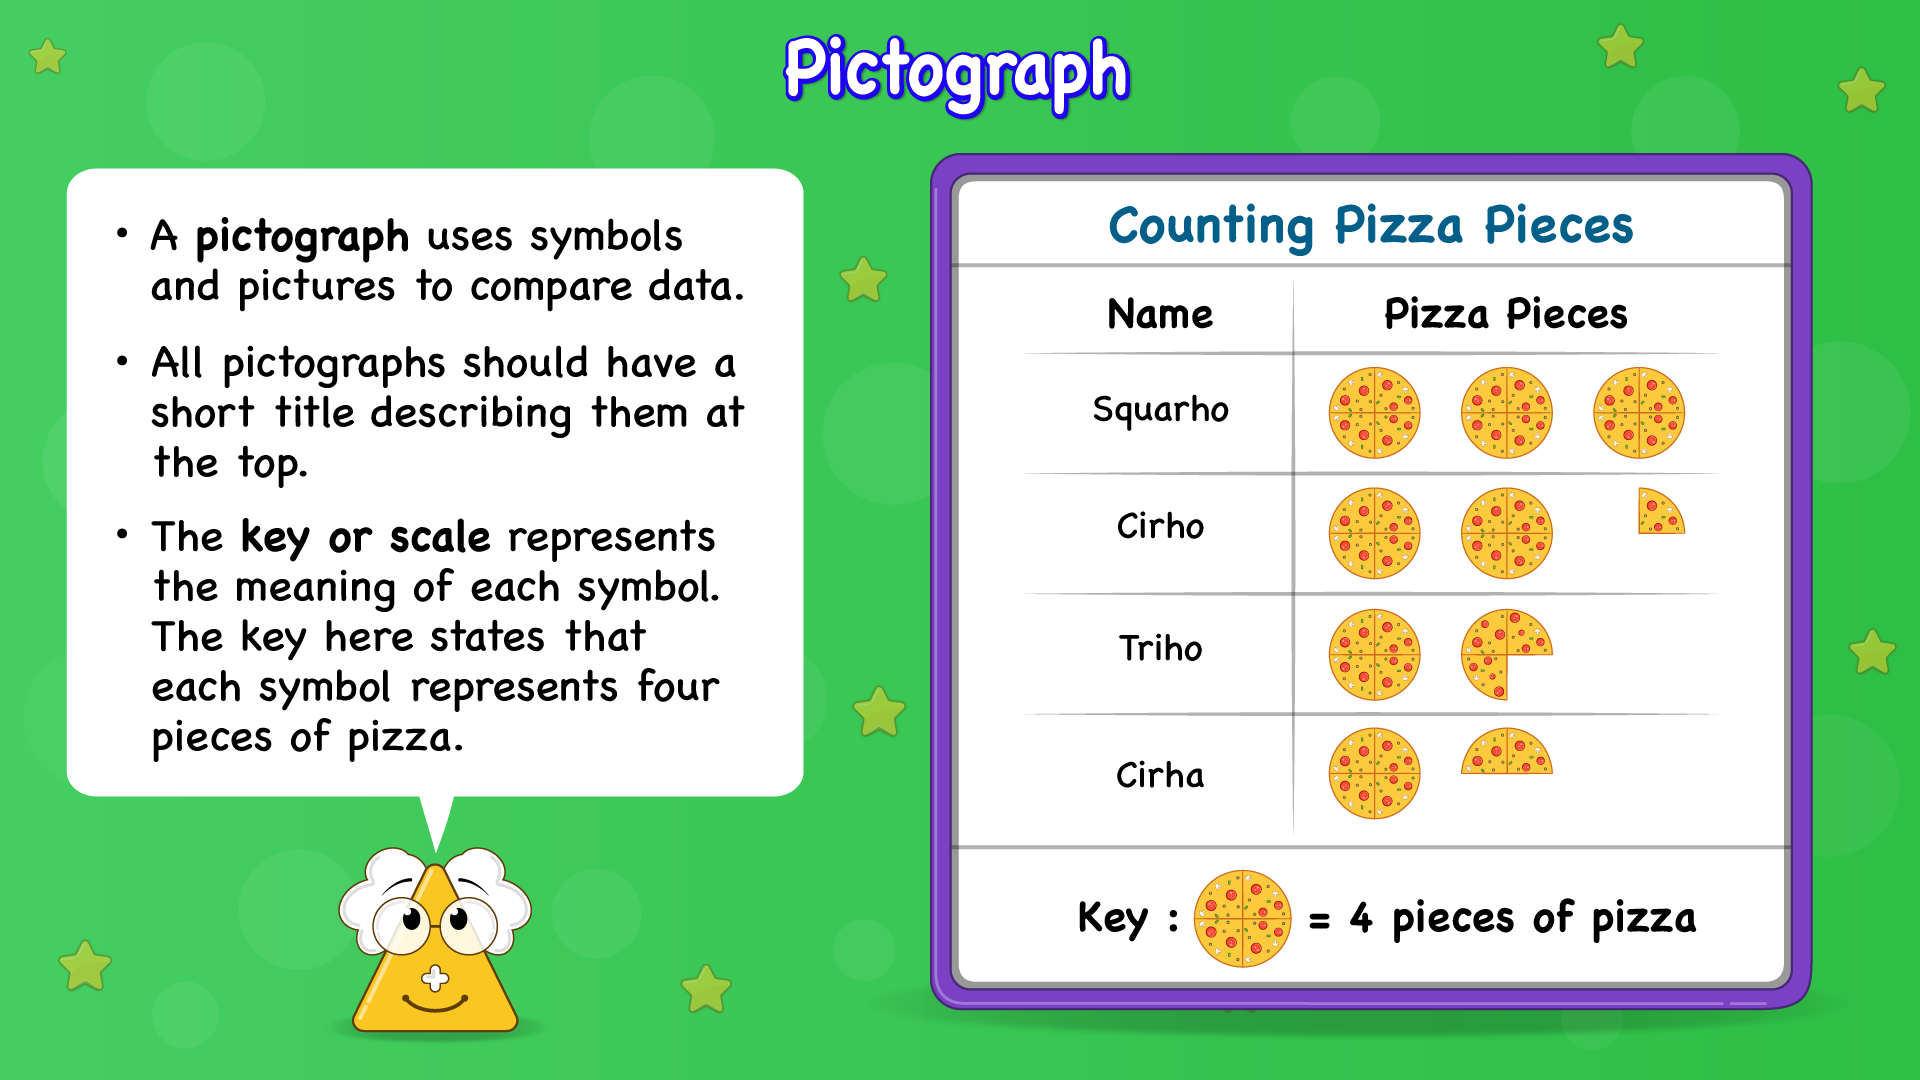
Pictographs : When Pictures Speak
A pictograph is often the first type of graph kids come across. Instead of numbers, we use pictures or symbols to show information. It’s visual, friendly and easy to grasp.
I remember how my niece, Meera, made a pictograph to show how many apples, bananas and oranges were eaten in their home over a week. Each fruit was drawn by hand, and suddenly Meera could see that bananas were the clear favourite. It sparked a chat at the dinner table and even led to a mini fruit survey among cousins.
Pictographs help kids connect data to their own lives. They are not just counting. They are storytelling.
Bar Graphs : Comparing with Confidences
Once kids are comfortable with pictographs, bar graphs are the next step. Here, data is shown using bars of different lengths. It’s perfect for comparing things.
Imagine your kid is tracking how many books they read each month. A bar graph can show that January was a slow start, but by March they were flying through stories. Once my friend’s son, Ami, used a bar graph to compare screen time across weekdays. It led to a gentle family chat about balance, and the graph became a tool for change.
Bar graphs give kids the power to compare, reflect and make decisions. It’s where the head comes in. Thinking critically and making sense of numbers.

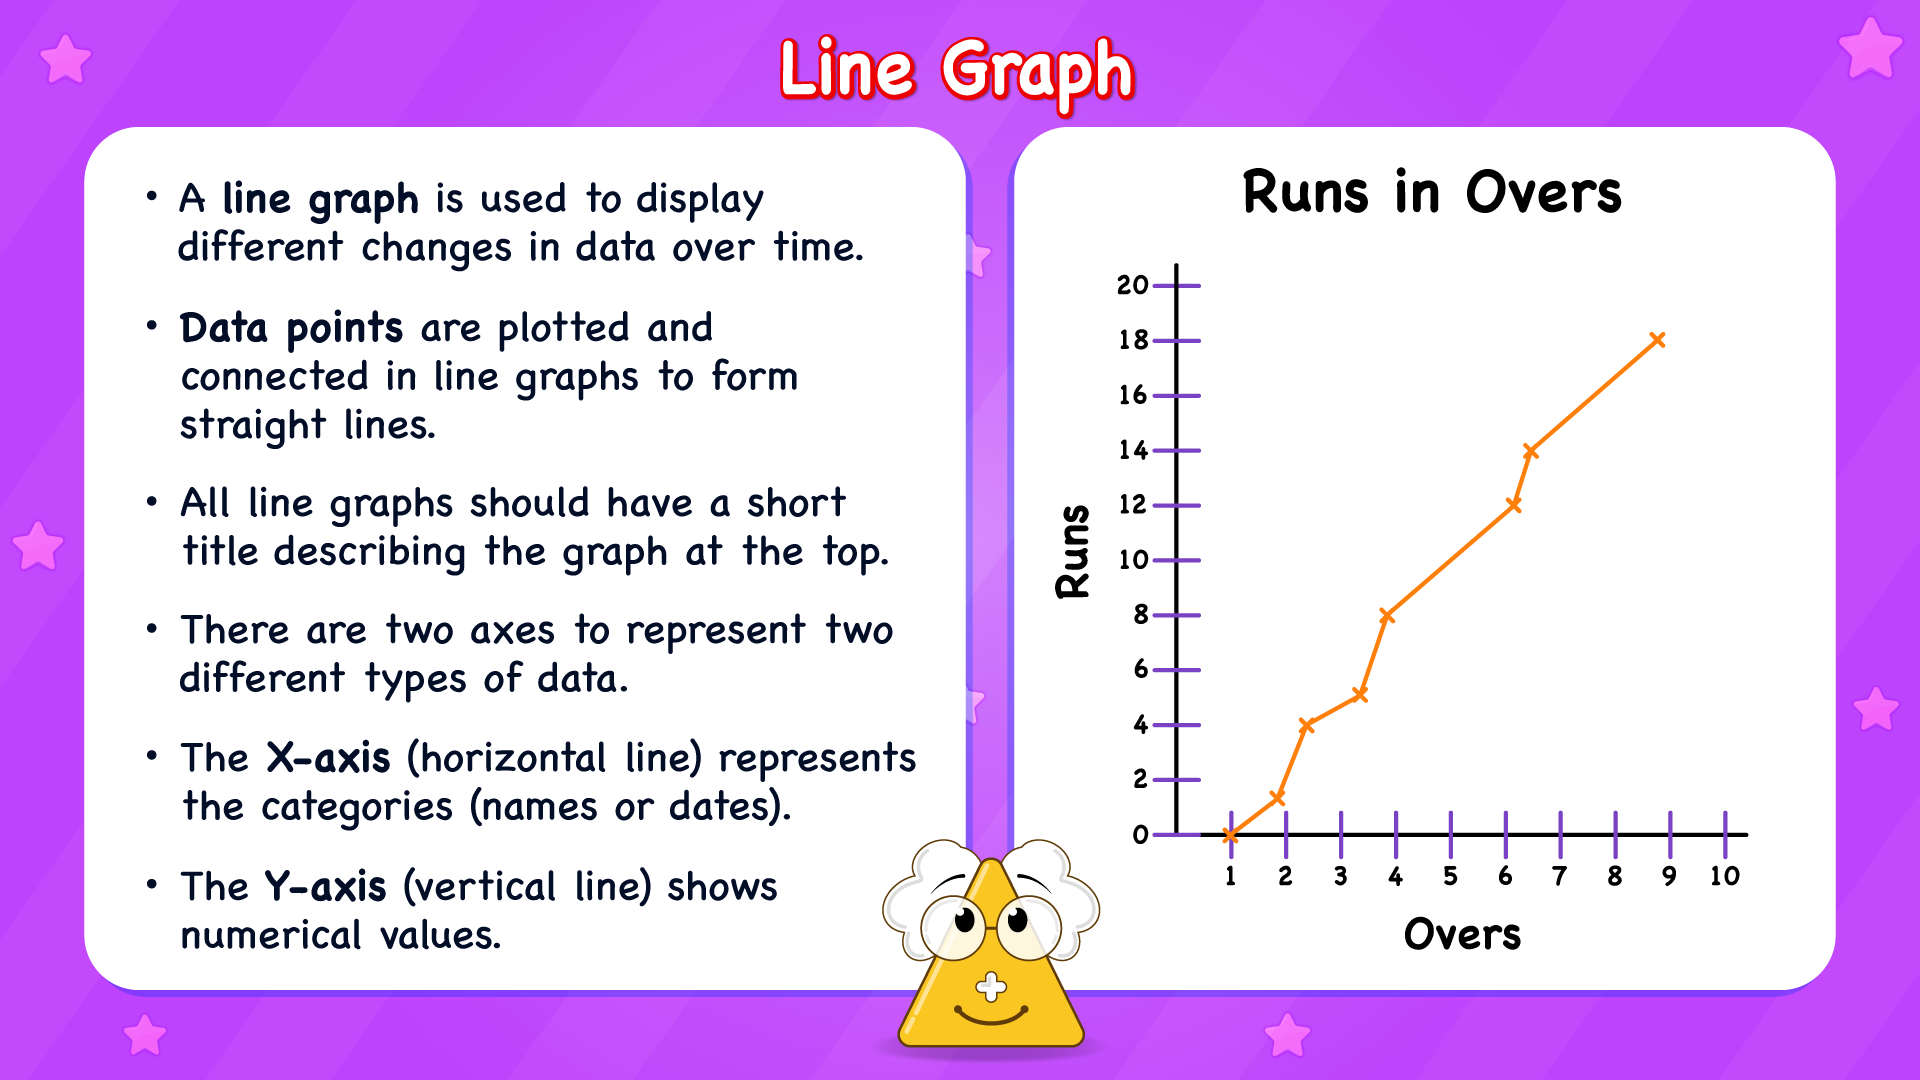
Line Graphs : Watching Things Grow
Line graphs are a bit more grown-up, but kids aged 10 and 11 are ready for the challenge. These graphs show how something changes over time, like temperature, height or even mood.
I remember how my elder daughter tracked her plant’s growth using a line graph. Every week, she measured the height and plotted it. Watching the line rise gave her a sense of pride and patience. It wasn’t just math. It was care, observation and a little bit of magic.
Line graphs teach kids to look for patterns, to predict and to understand that change is part of life. It’s the hand in action. Doing, recording and learning through experience.
Learning with Heart ❤️, Head 😃 and Hand 🖐️
Our eBook at Uncle Math Lab, shaped with the 3H approach, is designed to help families explore data handling in a way that feels warm, real and empowering.
Whether it’s counting toys, tracking weather or comparing snack choices, data handling becomes a shared adventure. And when parents join in, it becomes a memory.

A Final Thought
Data handling isn’t just a math topic. It’s a life skill. And when it’s taught with warmth and real-life relevance, it becomes something kids carry with them long after the lesson ends.
So next time your kid brings home a graph, don’t just glance at it. Ask them what story it tells. You might be surprised by what you learn. Not just about numbers, but about your kid.
And if you’re looking for a resource that brings this topic alive, our eBook is waiting…
Full of stories, activities and a whole lot of heart. Enjoy exploring…Let’s make learning feel like home.